 |
PlanningPro Description |
|
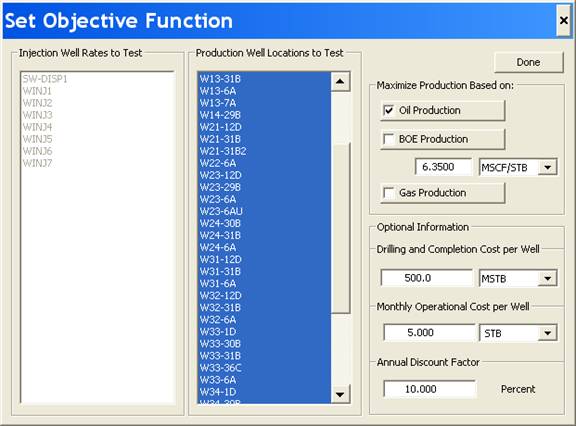
PlanningPro Functionality PlanningPro is an extension of the technologies encompassed in NITEC’s MatchingPro software. It is designed to aid the user in developing optimal drilling locations and schedules. The software utilizes all available computing resources and provides flexibility to the user in defining and scheduling the drilling program. Planning Pro utilizes a proprietary process to evaluate prospective new well locations, rank the new wells based on cumulative oil, gas or BOE production potential and determines the optimal combination of new wells. The technology developed in PlanningPro allows a minimal number of simulation cases to be utilized to determine the optimal case. The process is completely automated once the user specifies certain parameters. PlanningPro can currently be utilized with the Eclipse, Sensor and VIP simulators. The PlanningPro Process The prospective new wells to be evaluated and scheduled are first imported or input to PlanningPro. PlanningPro requires only the well name. The simulation data deck (template file) must include these same wells and the typical well information – I, J, K, PI, etc. The simulation deck should also include the typical well, field, gathering center constraints, gathering center identification, well types, etc. There is no limit to the number of prospective new wells that can be input at this time. The user will later be able to select the maximum number of wells to evaluate. The drilling schedule parameters must be input. These include days to drill each well, completion days per well, number of drilling rigs available and the start date for drilling. Simulation well types must be identified – Liquid producer, Oil producer, Water injector, etc. This should be consistent with the simulation data deck. The user will then define the maximum rate constraint for each of the wells. PlanningPro will write the well rate constraints to the simulation data deck. Having defined the basic well and simulation parameters, the user is asked to identify the actual new wells to be evaluated. Typically, if the original list of wells input to PlanningPro included 50 wells, all of these wells would be selected. However, this need not be the case. The user can then define the objective function to be based on cumulative oil, gas or BOE production. Economic parameters can also be input in order to calculate a pseudo Net Present Value for each case.
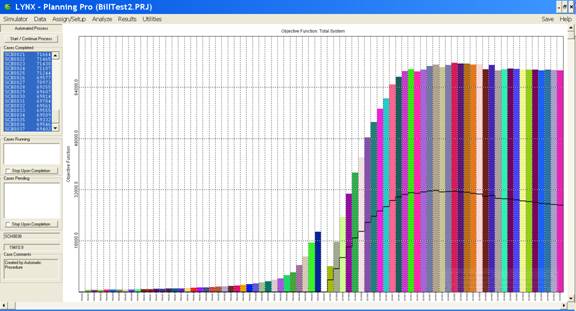
PlanningPro’s automated process first ranks all of the new wells to be evaluated. This is based on a proprietary objective function. This ranking is then used to simulate the model performance starting with the highest ranked well and adding each additional new well through to the lowest ranked well according to the drilling schedule parameters. The user can select all wells previously identified to be evaluated or a lesser number from the ranked list. The process of ranking the wells is carried out with simulation runs of a relatively short prediction period; shorter than the overall simulation prediction period desired. Three to five years may be simulated in the ranking runs if the full prediction period is 20 years. Once the ranking has been established the full prediction runs are made. As an example: Number of wells to evaluate 50 Duration of full prediction 25 yrs Duration of ranking runs 5 yrs Number of short ranking runs 50 Number of full prediction runs 51 (includes a “no new wells” base case) Prior to launching the automated process the user must define the various CPU’s to be used. Multiple CPU’s and simulator licenses will speed the process. As the process progresses a bar chart is generated to display the objective function value for each simulation case – ranking through scheduling cases. PlanningPro reports the cases being processed and those waiting to process. If economic parameters were input on the Objective Function screen, the “pseudo” economic analysis, discounted net present value is displayed. (Black line on each bar.)
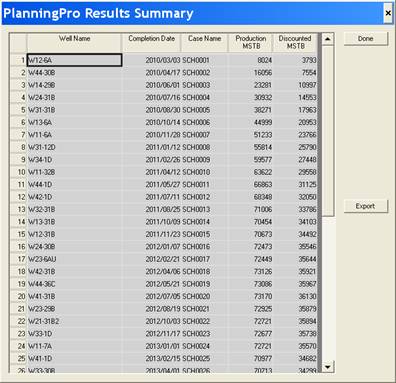
The resulting drilling schedule can be displayed along with the production for each well. Case SCH001 includes only the highest ranked well; W12-6A in the case below. The highest oil production from the new wells occurs in Case SCH020 - 73,170 MSTB. Wells W12-6a through W41-31B are included in that case.
PlanningPro allows the user to display production rate and cumulative plots for any of the simulated cases and compare one case to another. Results can also be exported to .csv files for use in other applications. The display below shows all 46 prospective new wells considered in the evaluation.
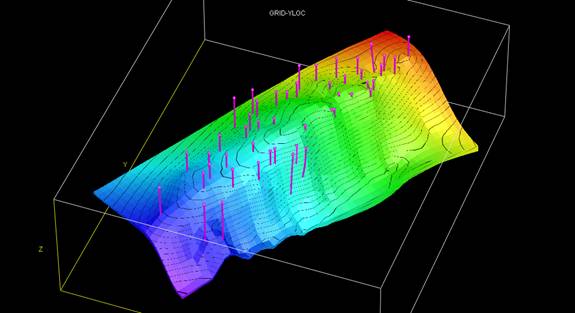
The display below shows the 20 new wells in the optimal case. 26 wells in the original group were not required to achieve maximum oil production from the field.
|